Debugging Camel K Integrations
Sometimes integrations can fail or behave unexpectedly for unknown reasons and a developer needs to investigate the cause of such behavior. Attaching a debugger to an integration is a common way to start the investigation.
Even if Camel K integrations run on a Kubernetes cluster, it’s very easy to attach a debugger to the remote integration using the CLI.
Suppose you just launched an integration using the following command:
kamel run examples/Sample.javaAn integration named sample should be running in the cluster.
You can use the kamel debug command to put it in "debug mode".
kamel debug sampleA possible output that you may find is the following:
$ kamel debug sample
Enabling debug mode on integration "sample"...
[1] Monitoring pod sample-8455c8b985-5cxvc
[1] exec java -agentlib:jdwp=transport=dt_socket,server=y,suspend=y,address=*:5005 -cp ./resources:[..omitted..] io.quarkus.runner.GeneratedMain
[1] Listening for transport dt_socket at address: 5005
Forwarding from 127.0.0.1:5005 -> 5005
Forwarding from [::1]:5005 -> 5005
As you can see in the logs, the CLI has configured the integration in debug mode (see option -agentlib:jdwp=transport=dt_socket,server=y,suspend=y,address=*:5005)
and started forwarding the local port 5005 on the workstation machine (local port can be changed using the --port option) to the container port 5005, where the JVM is waiting for a debugger.
The JVM is suspended and waits for a debugger to attach by default: this behavior can be turned off using the --suspend=false option.
Last thing to do is, with your IDE opened on the integration file (if using Java, Groovy or Kotlin), the Apache Camel project or the Camel K Runtime project,
to start a remote debugger on localhost:5005.
The following picture shows the configuration of a remote debugger in IntelliJ Idea.
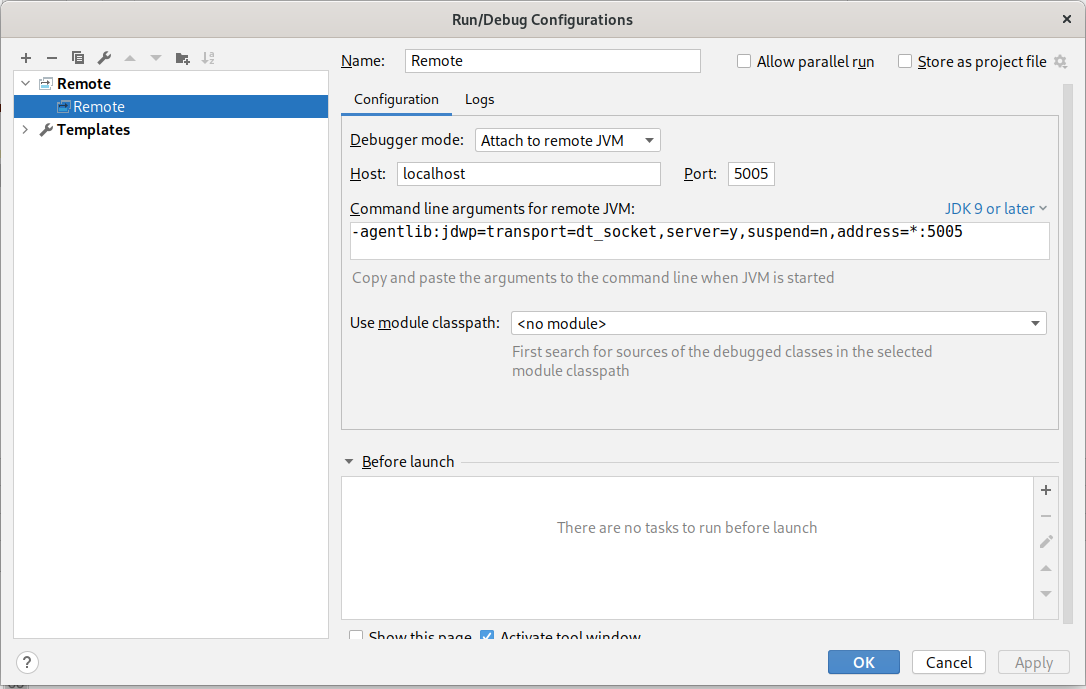
Once you configure a debugger, you can add breakpoints to various part of the code, then connect the debugger to trigger the JVM startup.
When the debugging session is finished, hitting ctrl+c on the terminal where the kamel CLI is running will restore the integration to its original status.